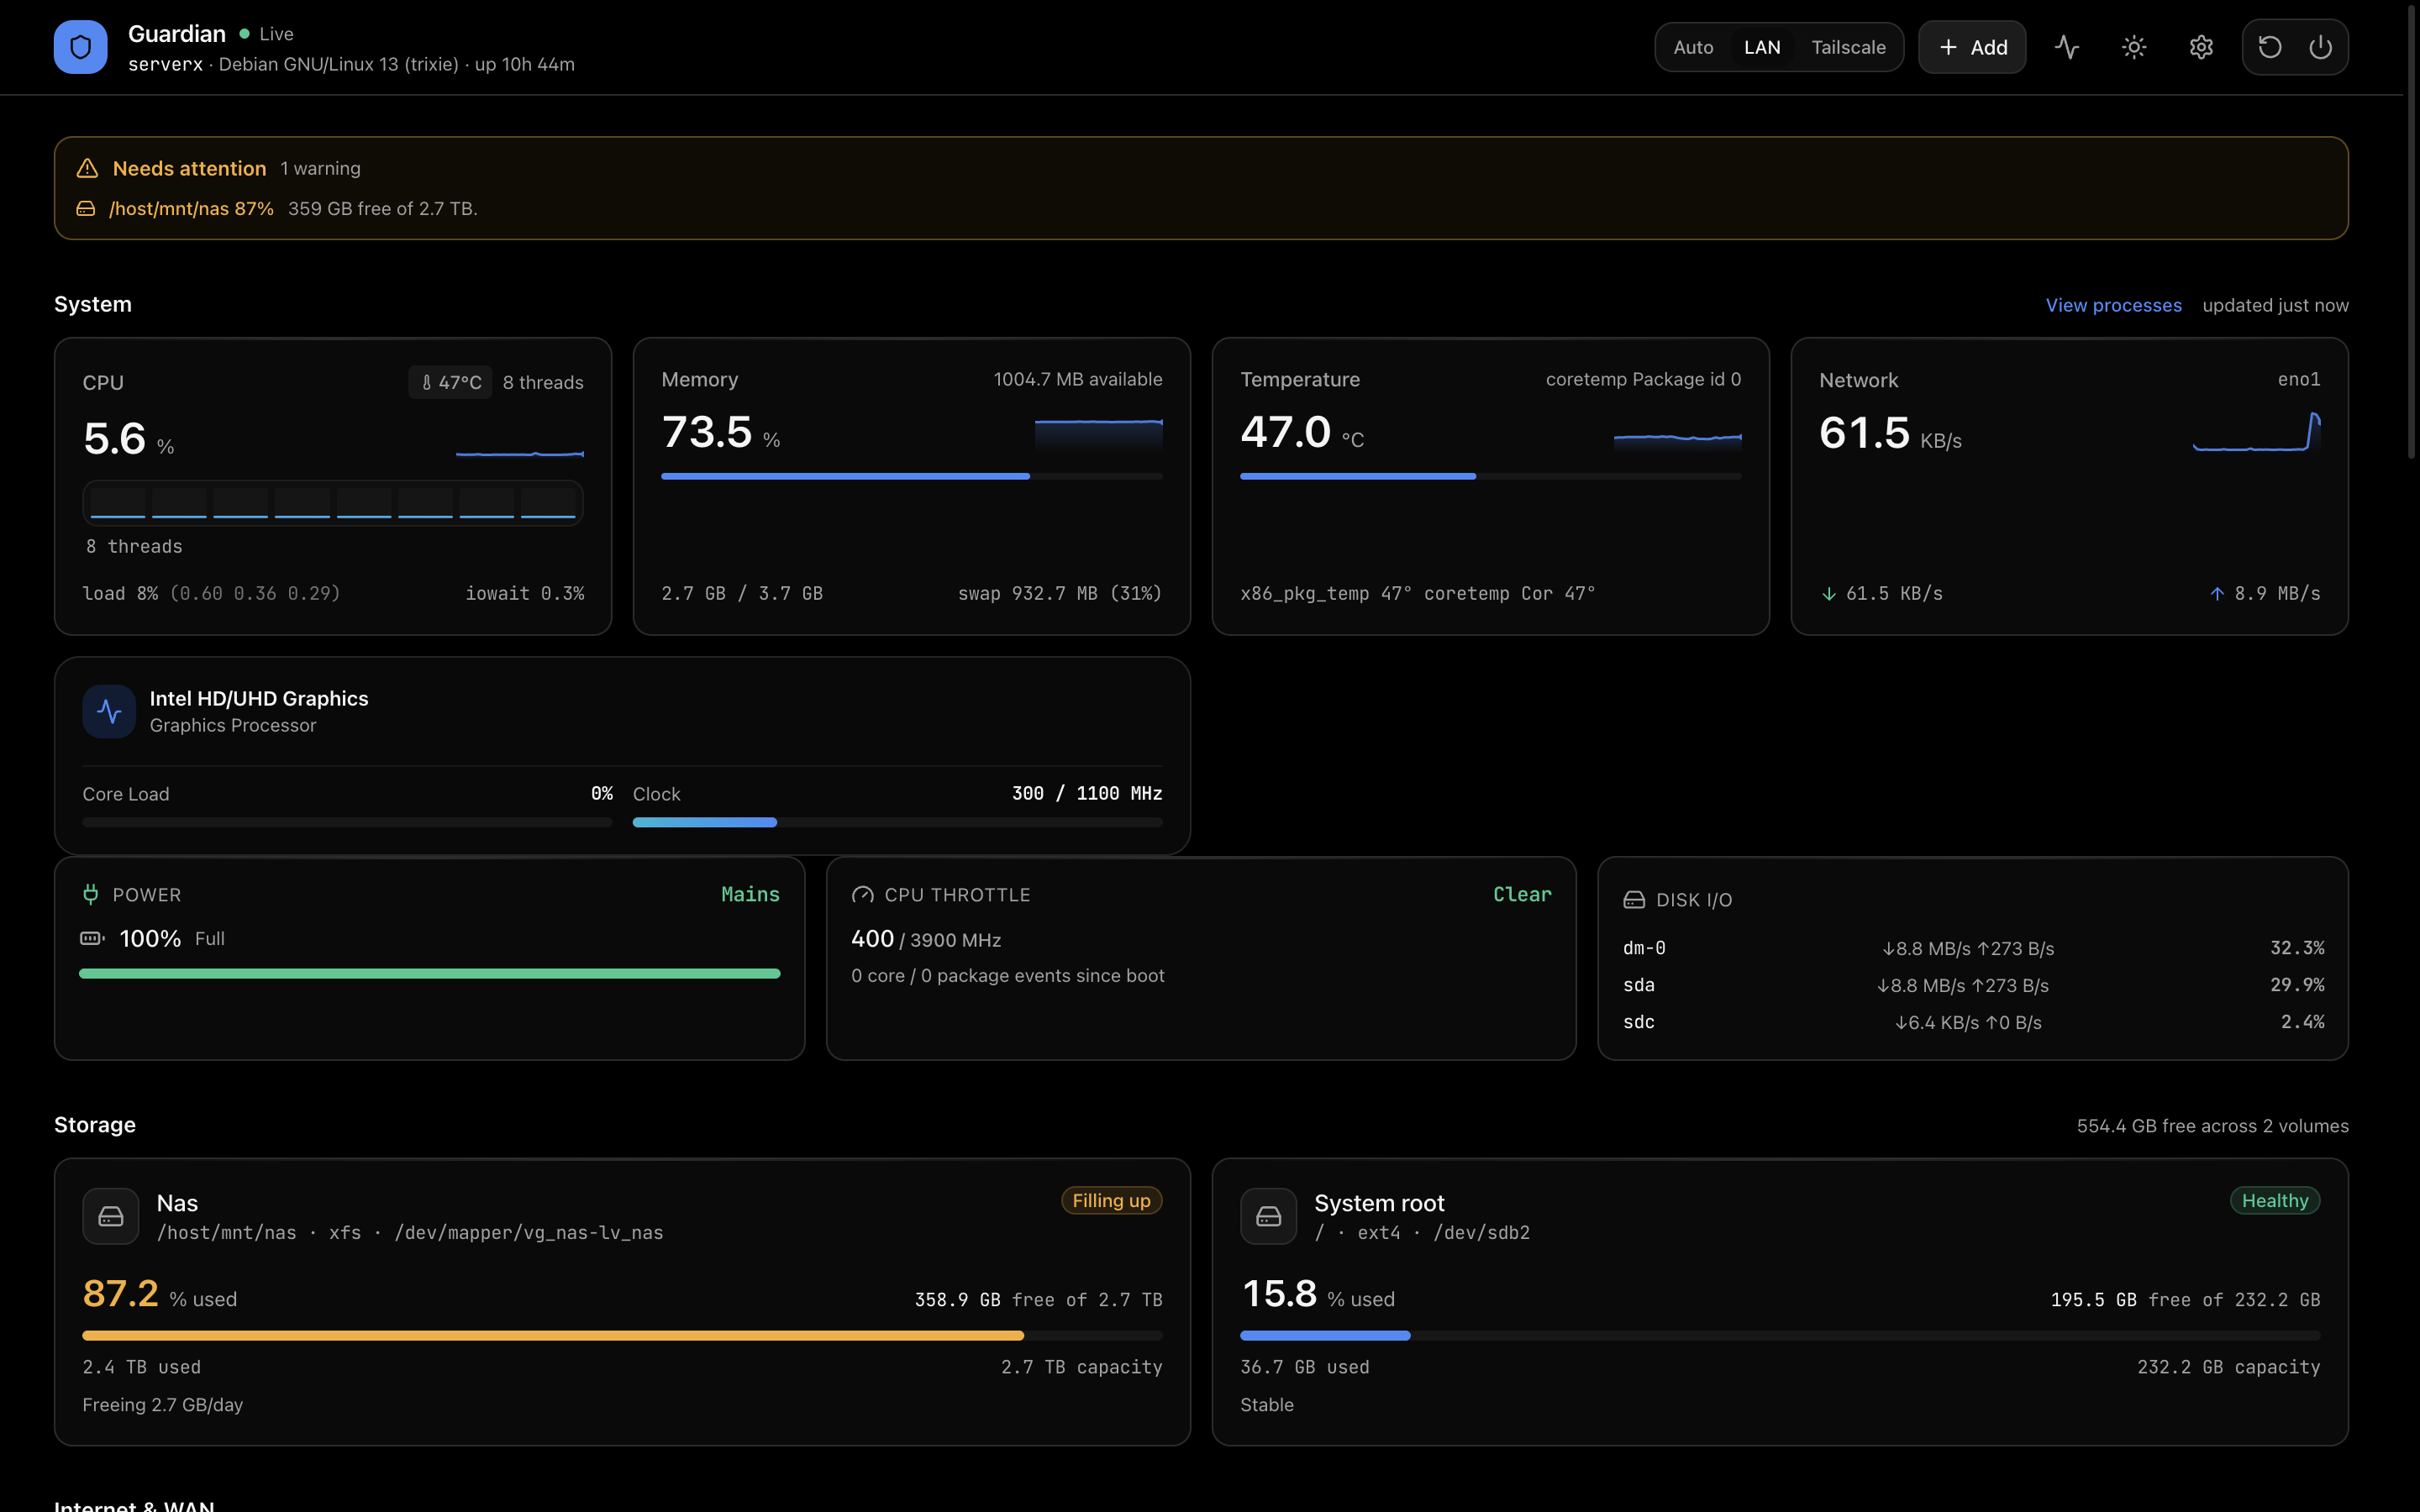
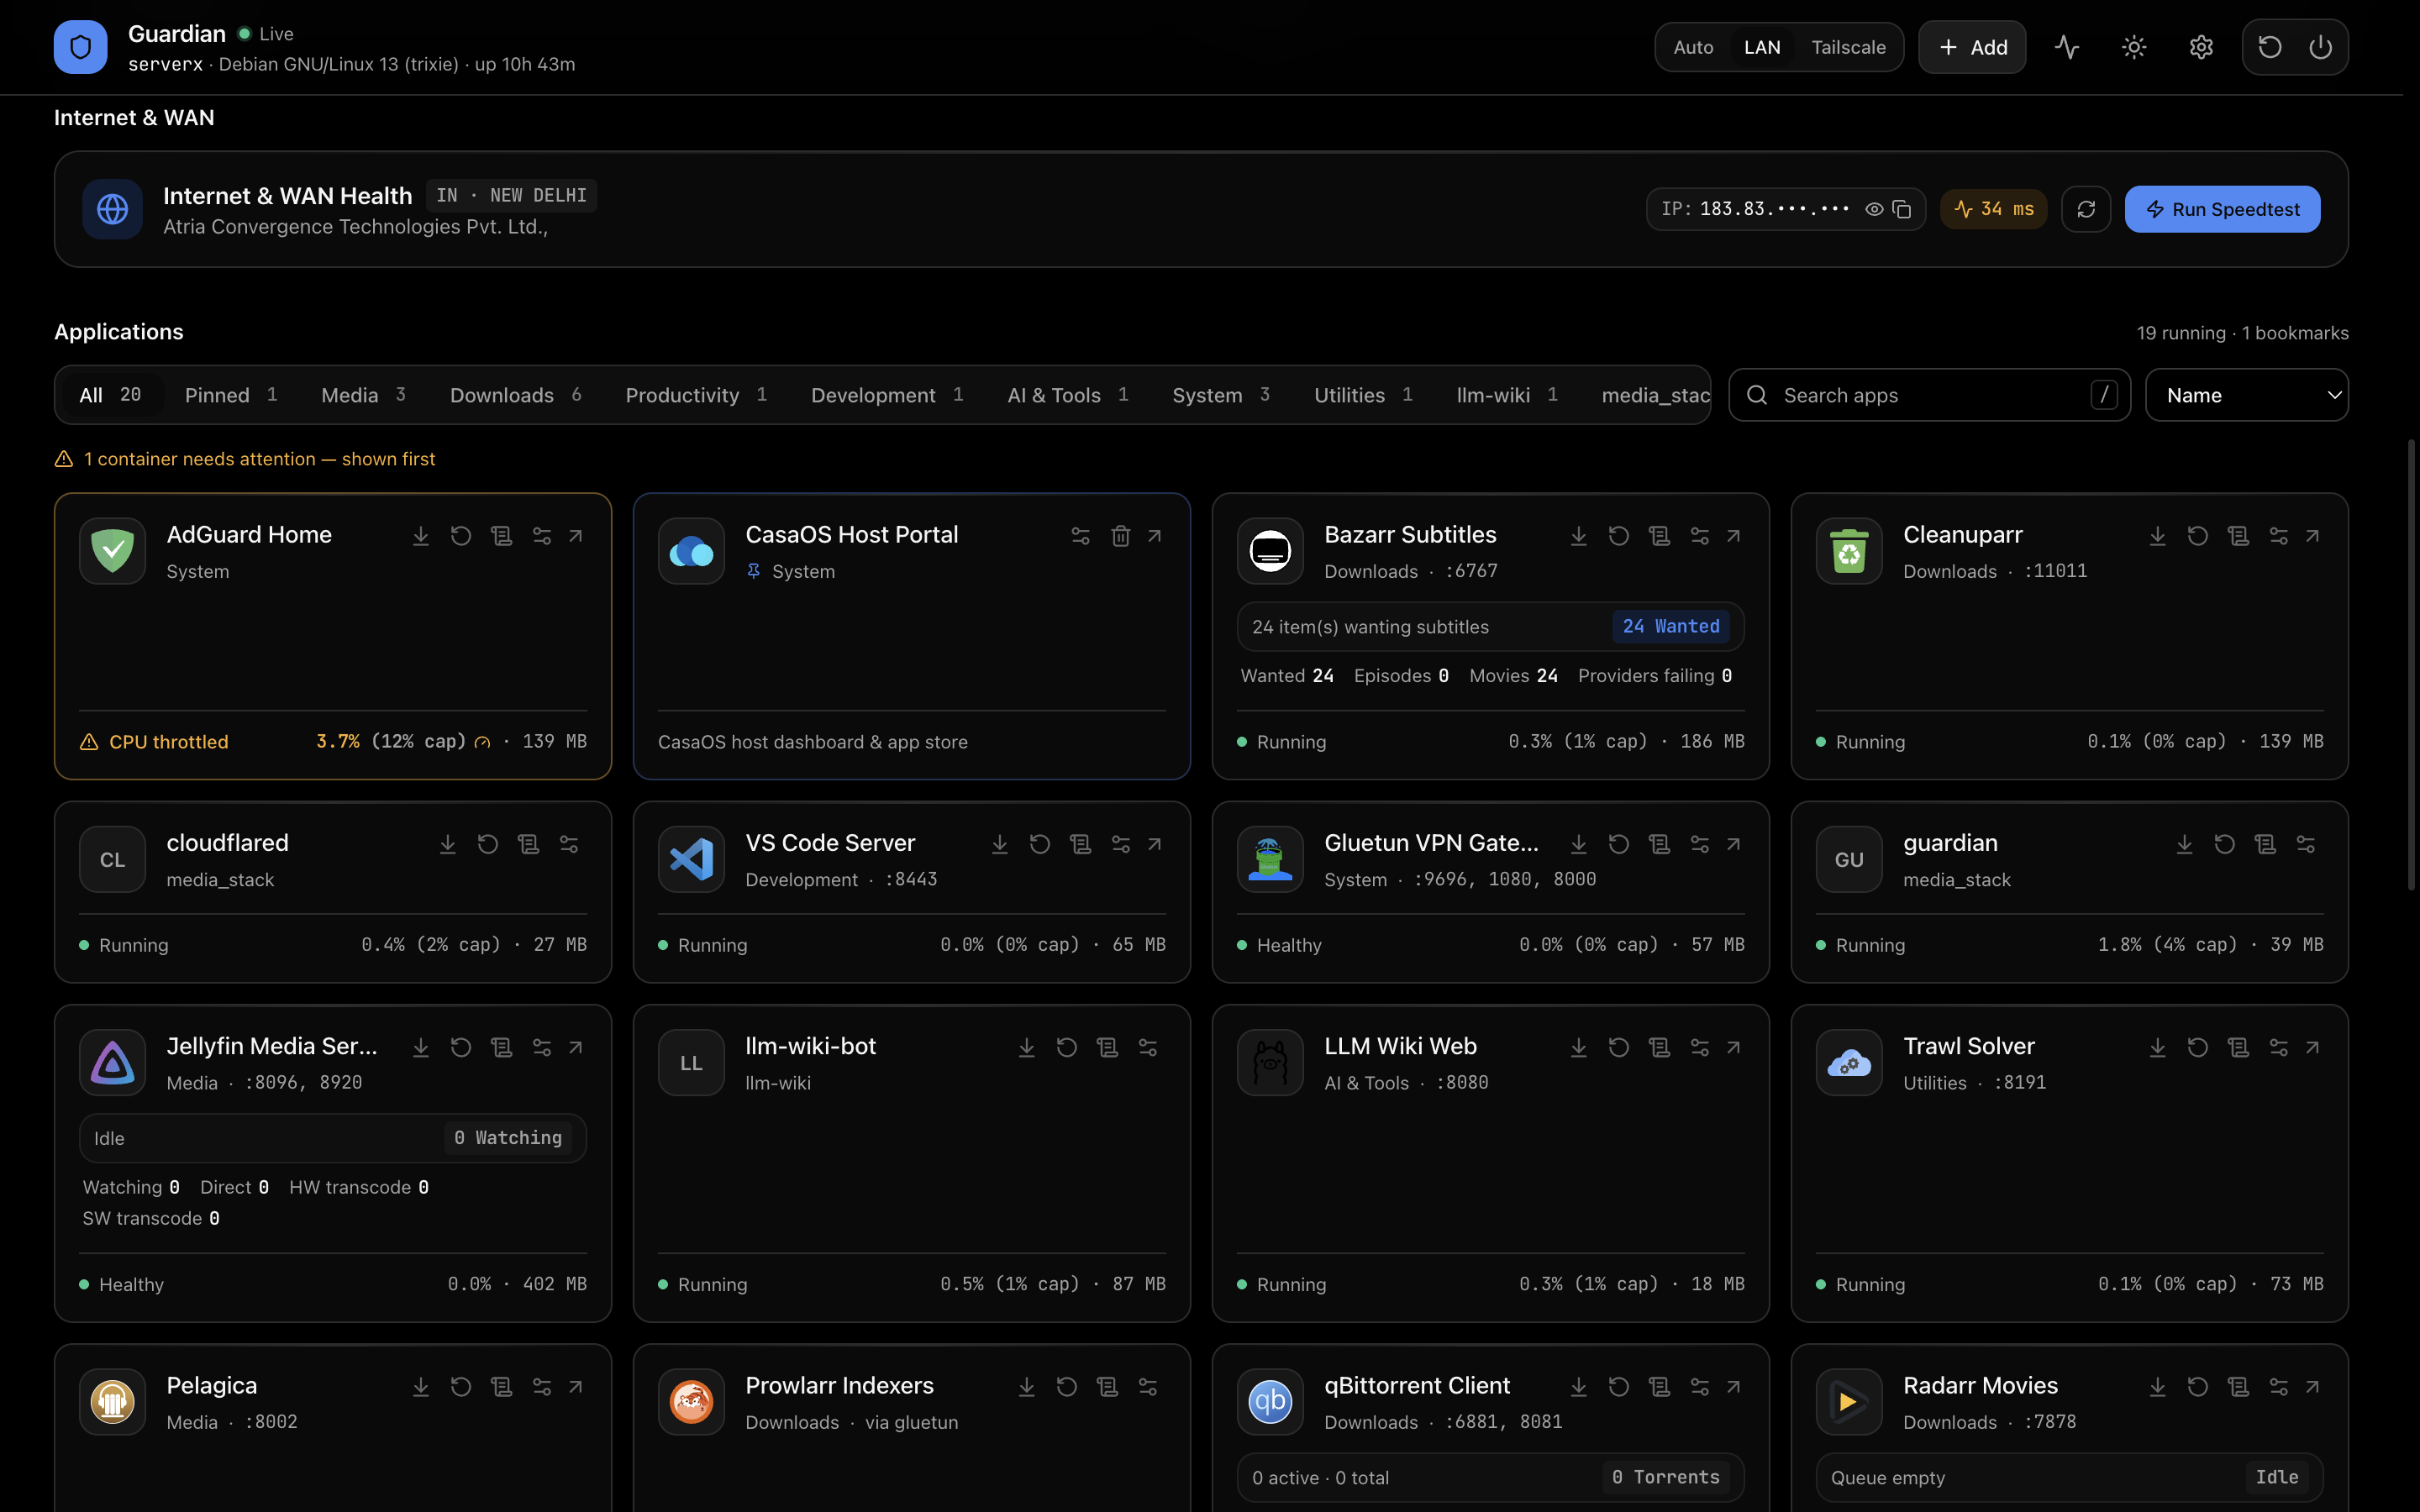
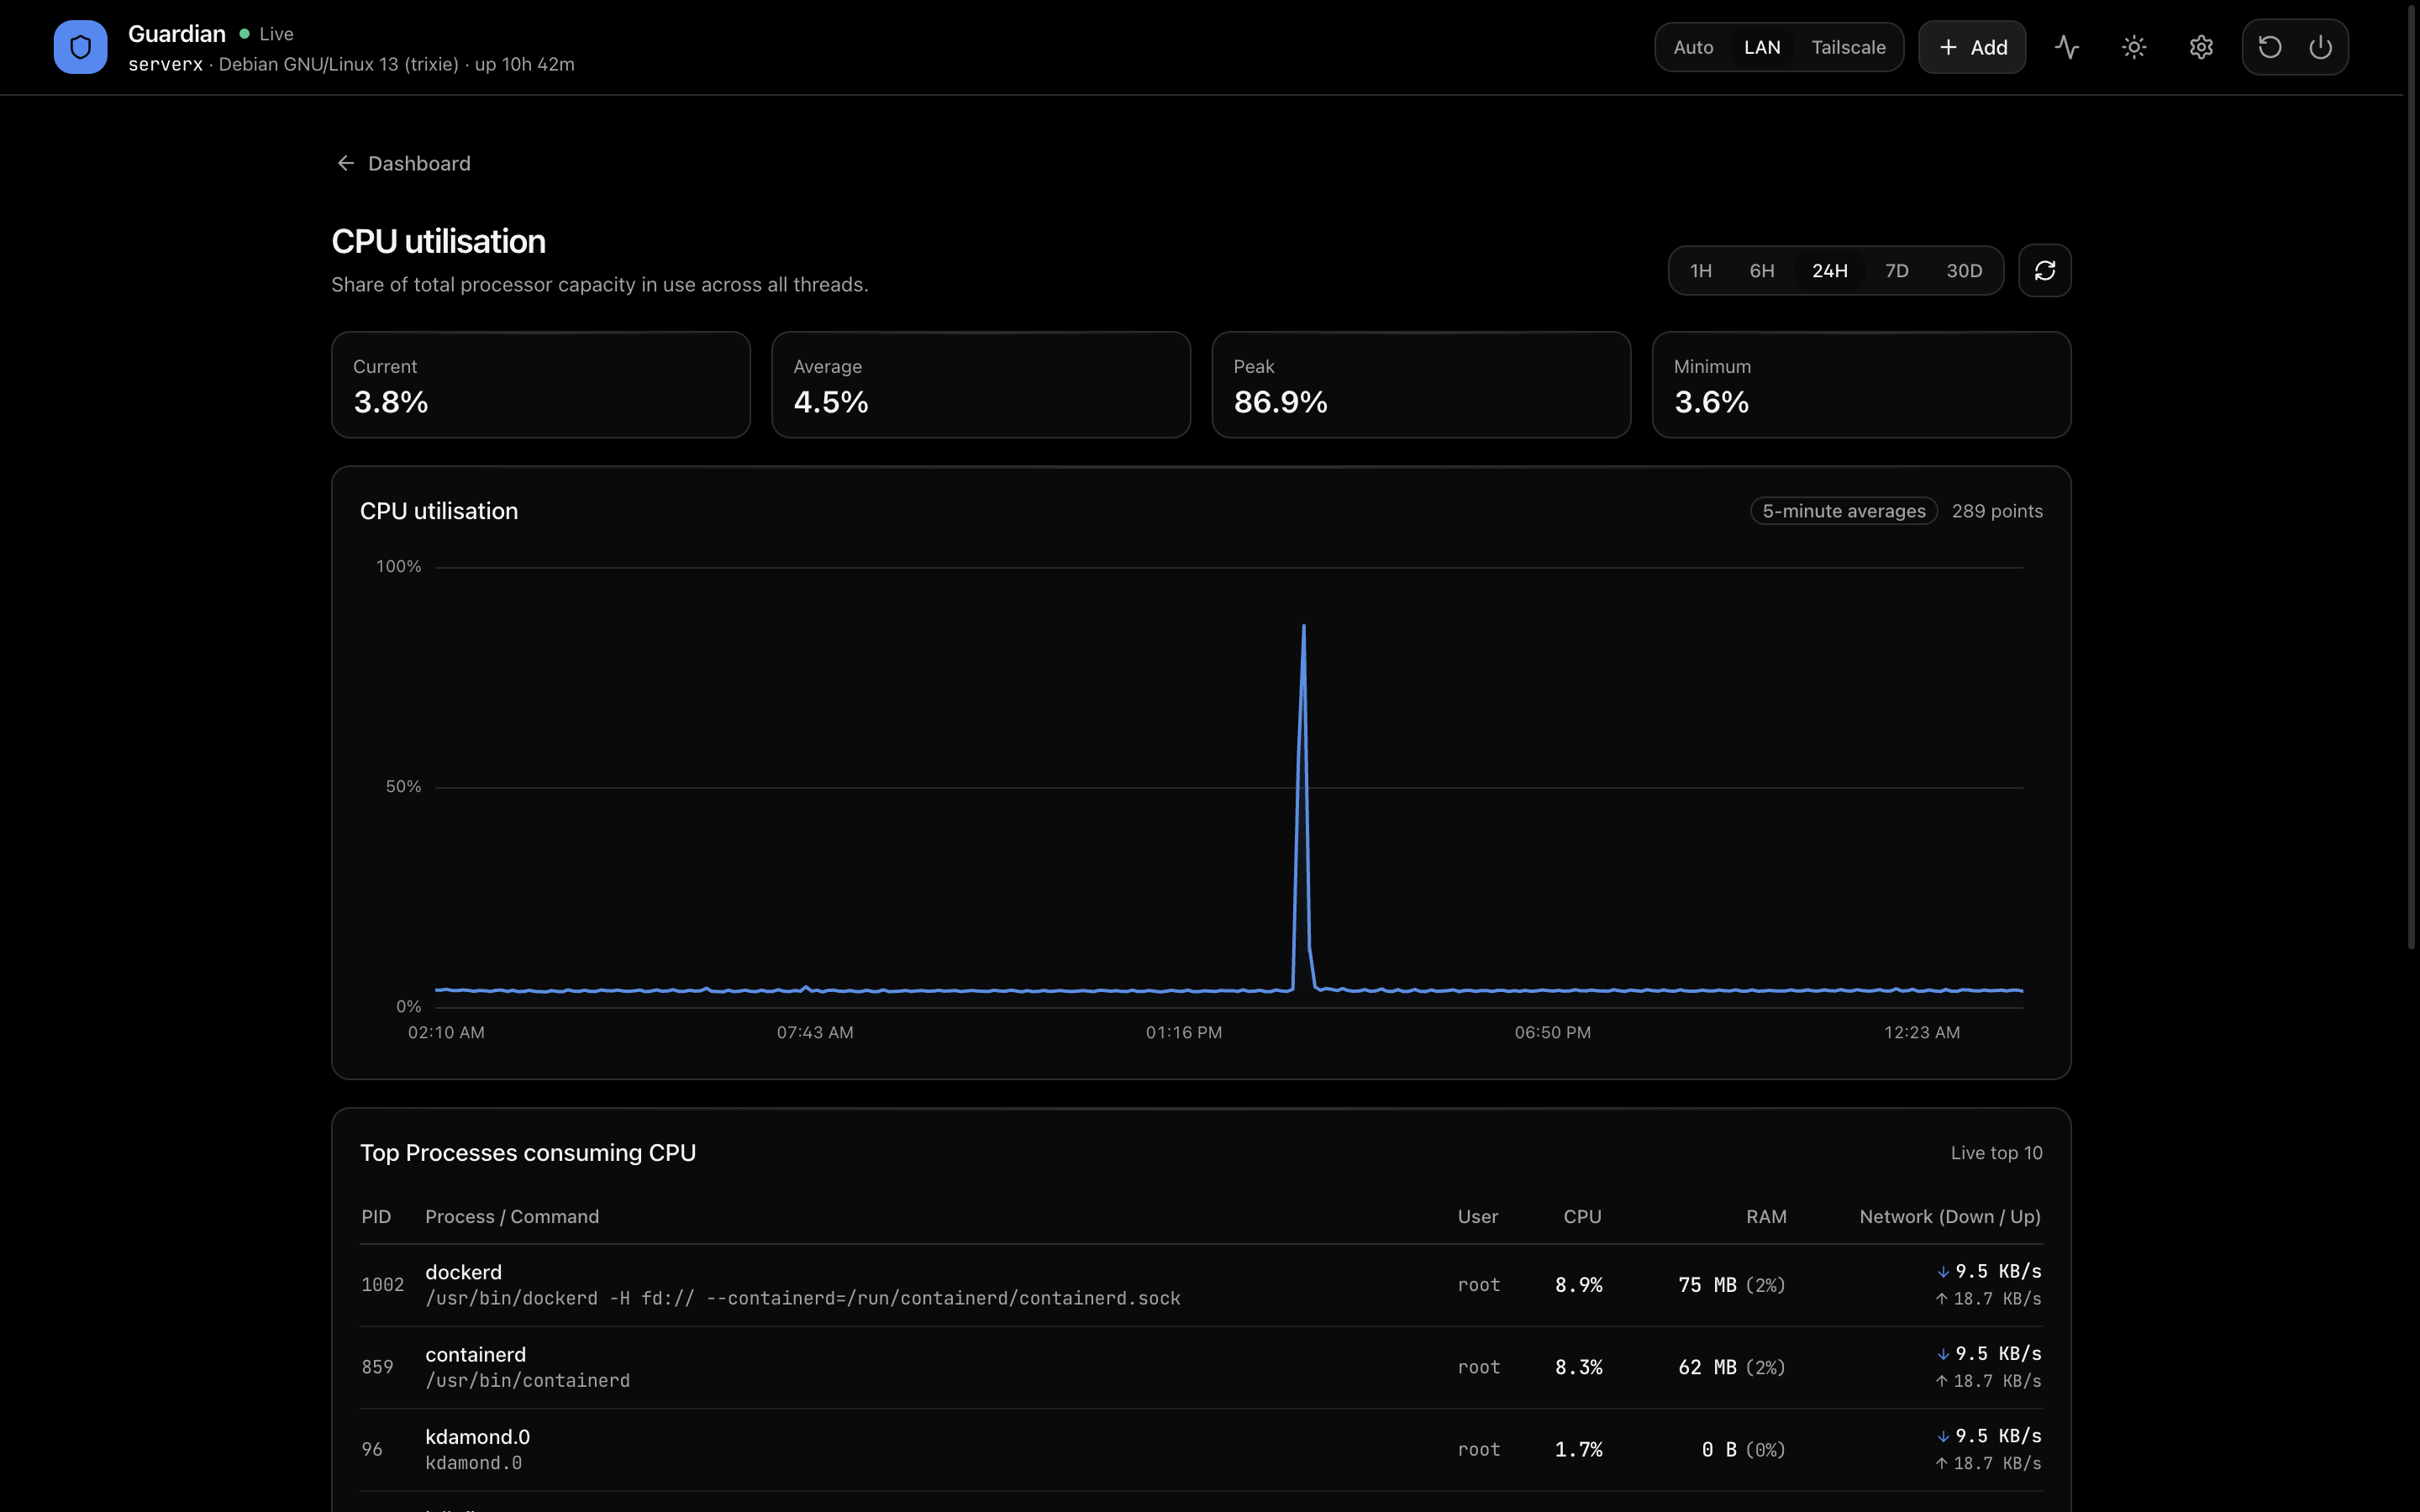
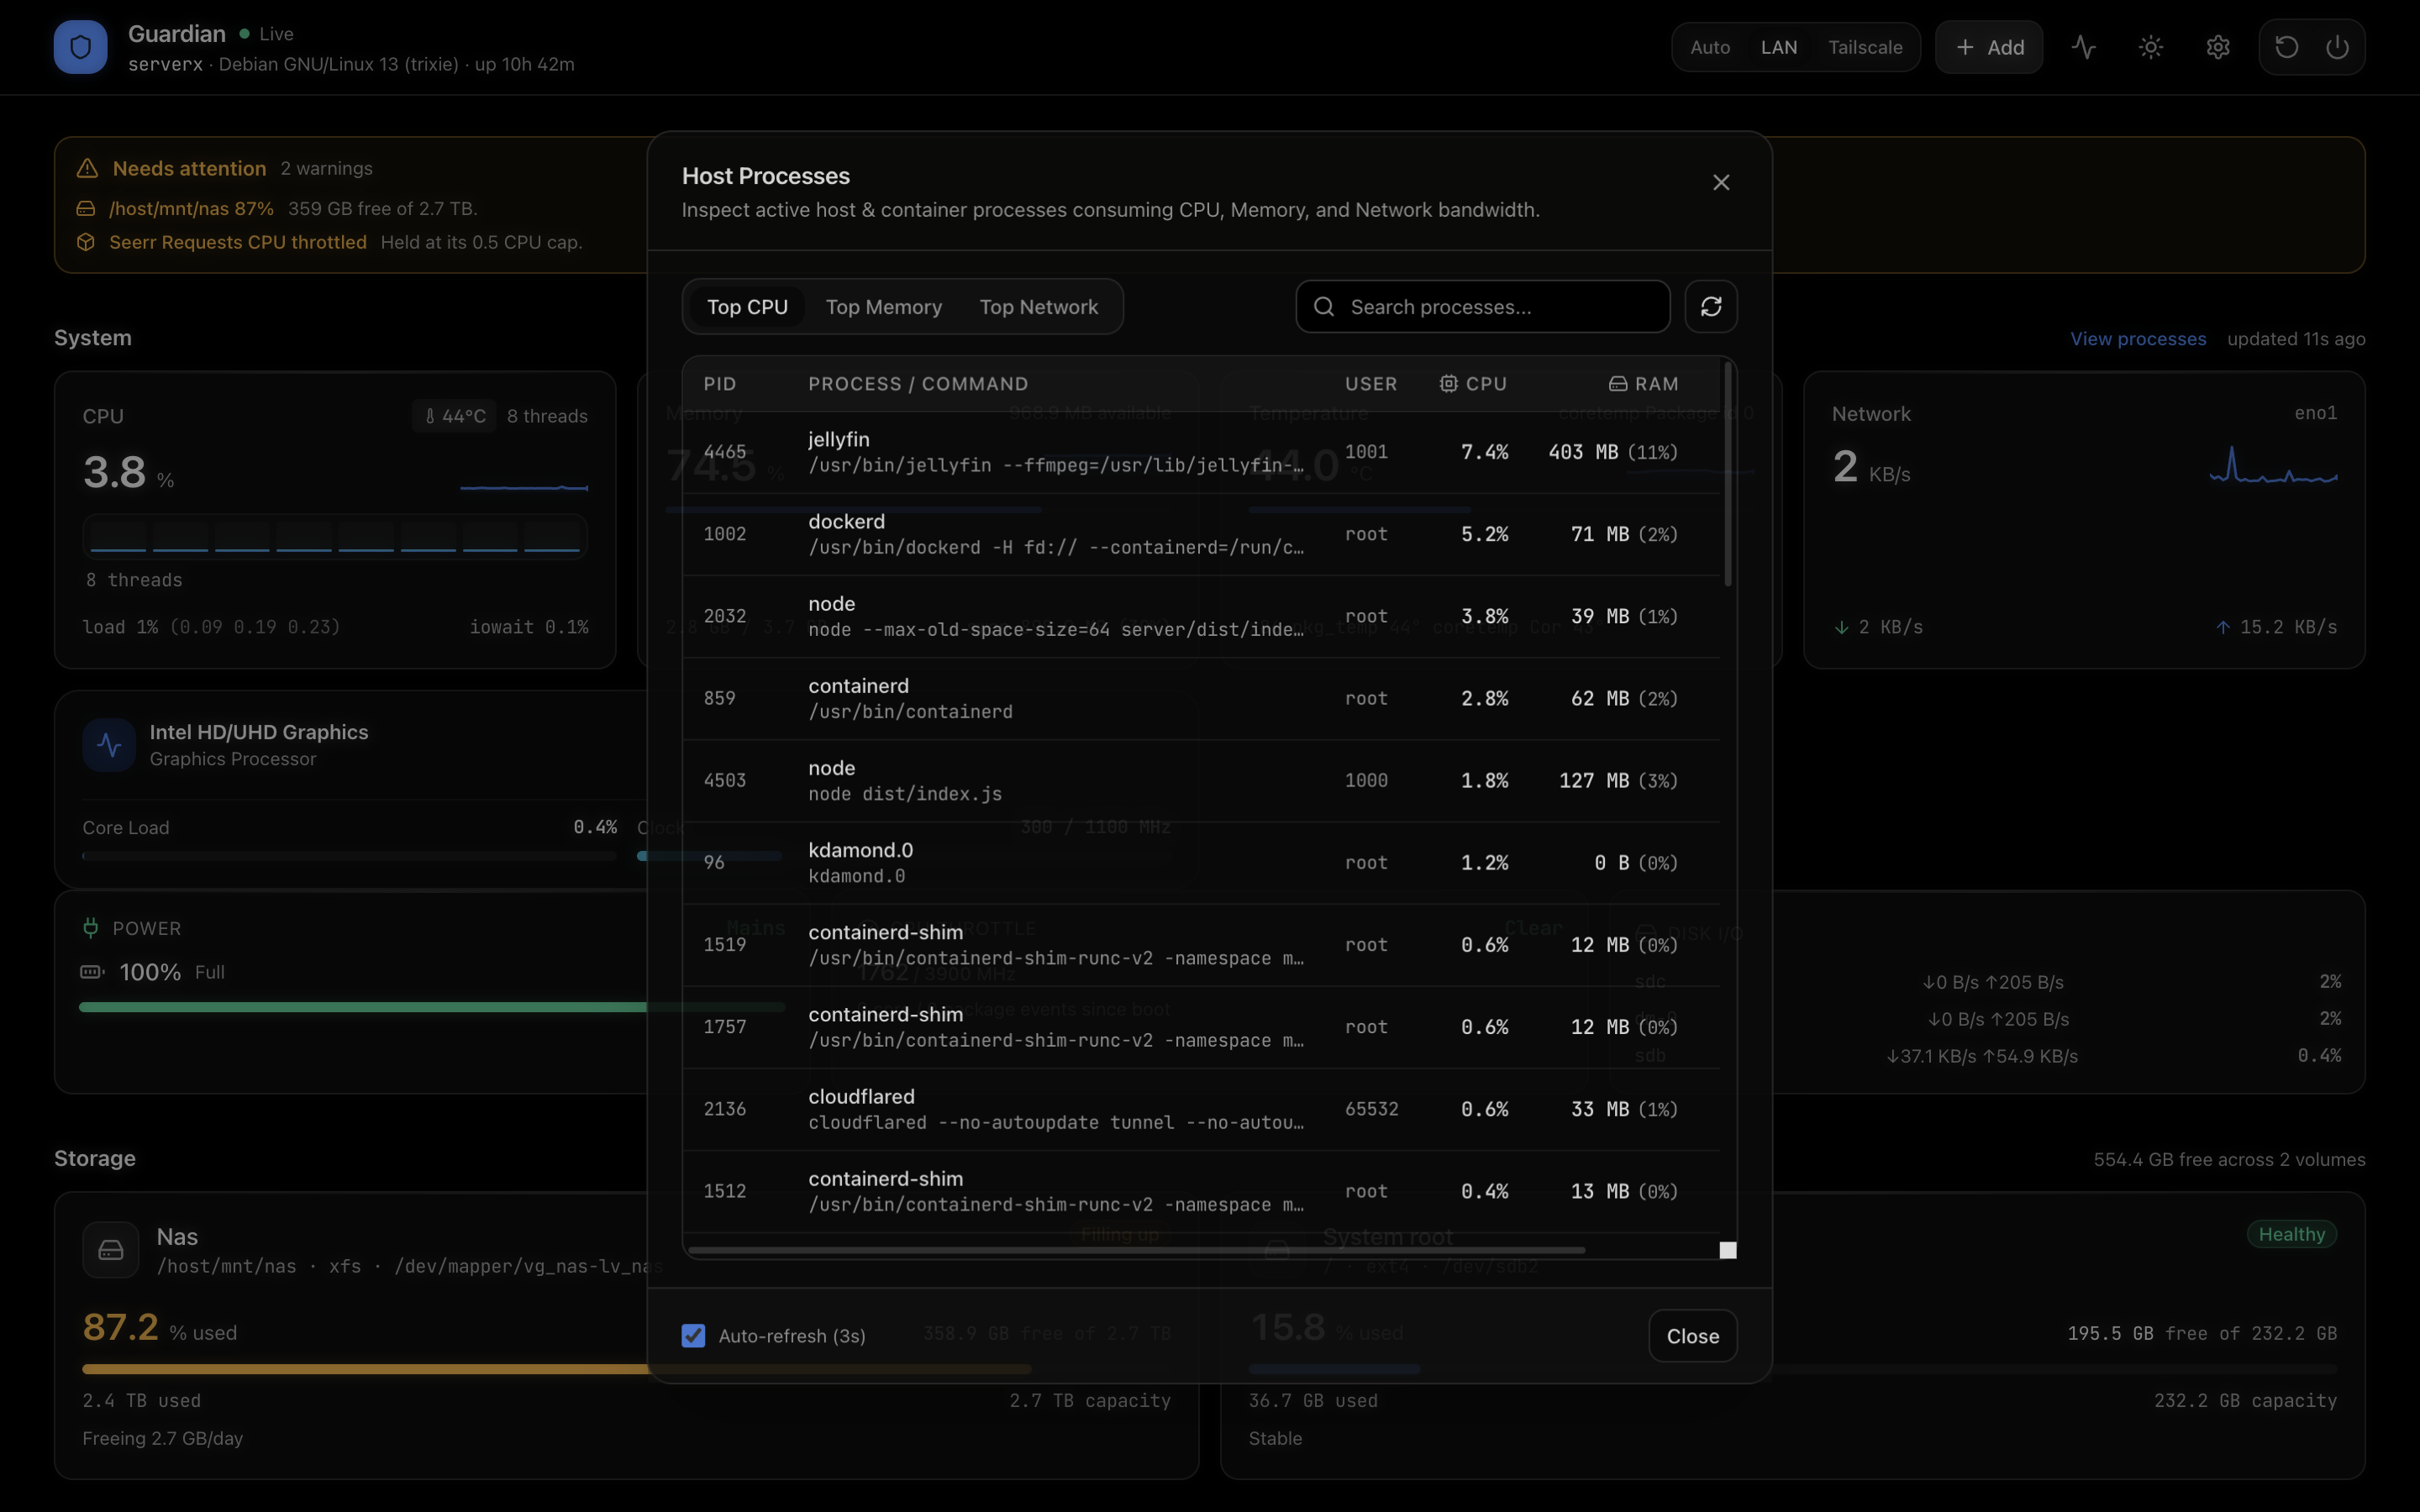
Host telemetry straight from /proc and /sys, automatic Docker container discovery, HTTP endpoint health checks, and an app launcher — one static binary, no agents, no external database.
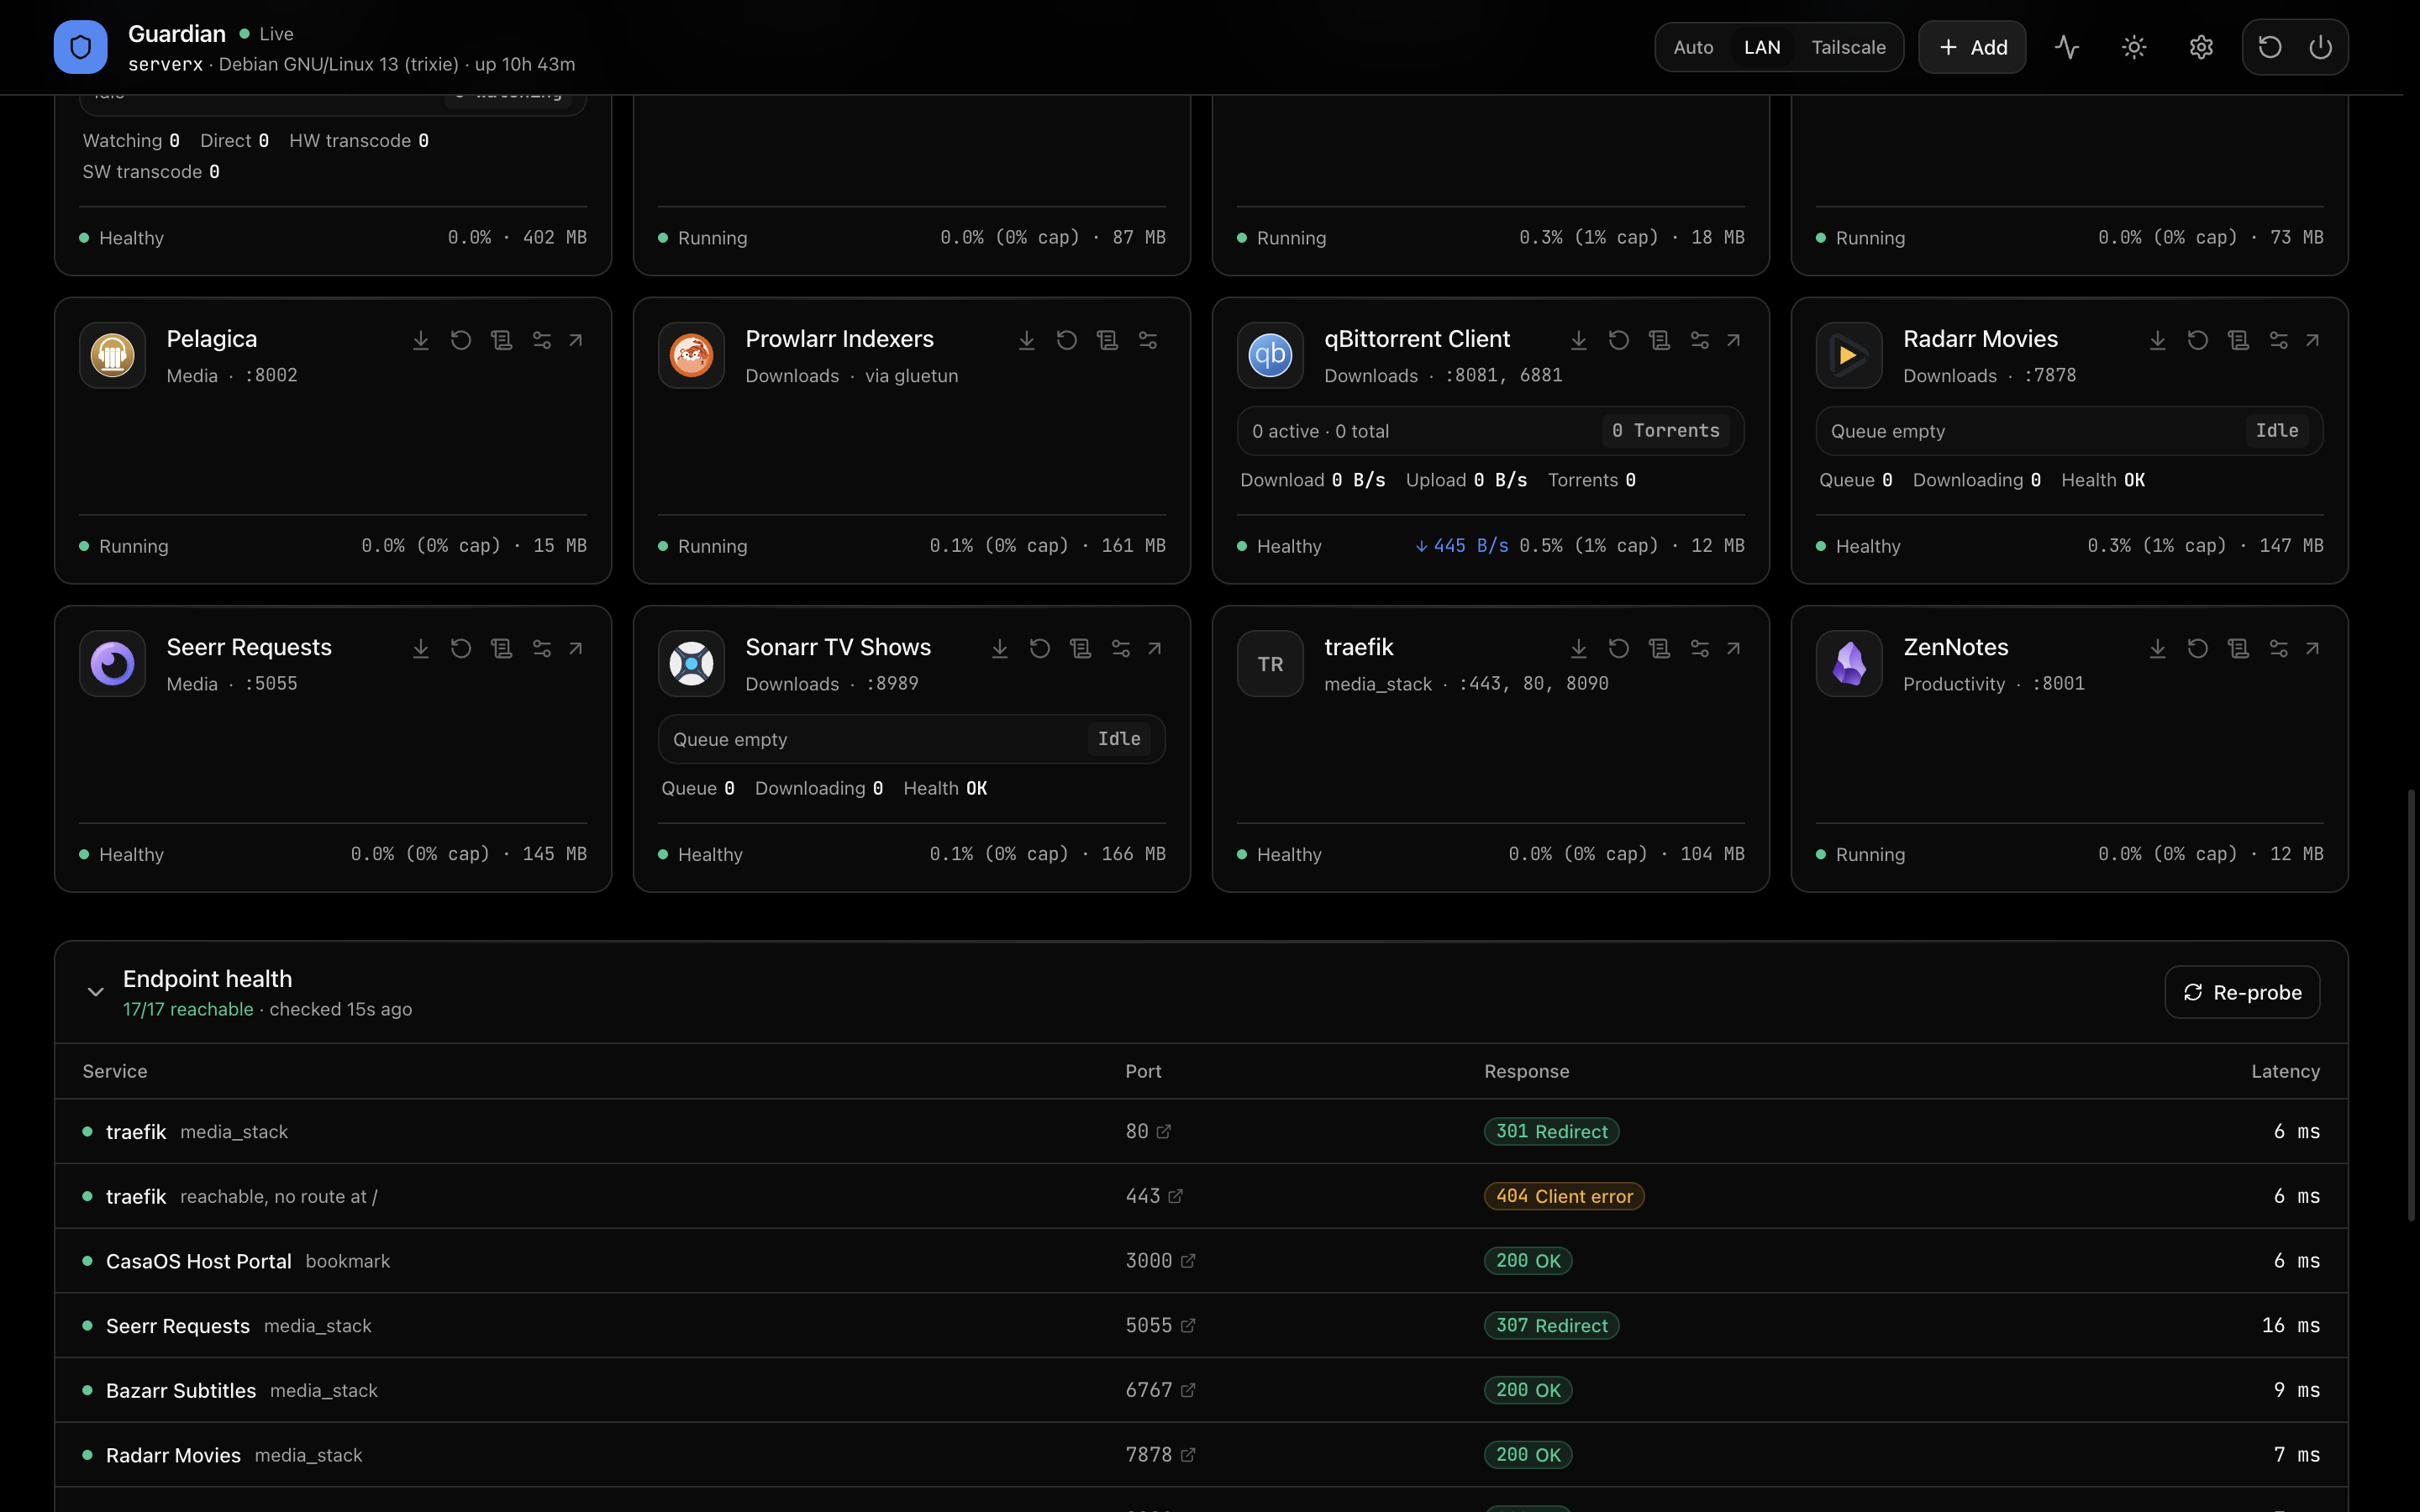
Guardian's actual dashboard — not a mockup. Click a tab to explore.
Copy one command, or grab the full compose file below.
curl -sSL https://raw.githubusercontent.com/vineetkishore01/Guardian/main/docker-compose.yml.example -o docker-compose.yml && docker compose up -d
services:
guardian:
image: ghcr.io/vineetkishore01/guardian:latest
container_name: guardian
restart: unless-stopped
ports:
- "3001:3001"
volumes:
# Docker socket — container discovery, live stats, logs, restart, prune
- /var/run/docker.sock:/var/run/docker.sock
# Host telemetry (procfs & sysfs) — CPU, RAM, PSI pressure, thermals, fans
- /proc:/host/proc:ro
- /sys:/host/sys:ro
# Host identification — real distro name & hostname
- /etc/os-release:/host/etc/os-release:ro
- /etc/hostname:/host/etc/hostname:ro
# Host storage (rslave discovers submounts like /mnt, /media)
- /:/host/root:ro,rslave
# Persisted icons, bookmarks, settings, 30-day history, logs
- guardian_data:/data
environment:
- NODE_ENV=production
- PORT=3001
- HOST_PROC=/host/proc
- HOST_SYS=/host/sys
- HOST_ETC=/host/etc
- HOST_ROOT=/host/root
# Optional: seed LAN / Tailscale launch IPs for app tiles
# - SERVER_IP=192.168.1.100
# - TAILSCALE_IP=100.x.y.z
# Optional: enable guarded shutdown/reboot (off by default)
# - ENABLE_POWER_CONTROLS=false
deploy:
resources:
limits:
memory: 128M
cpus: '0.50'
volumes:
guardian_data:
name: guardian_data
linux/arm64 & linux/amd64
No cloud telemetry. No heavy JavaScript bundles. Just kernel VFS reads and Server-Sent Events.
Directly reads /proc/stat, /proc/meminfo, /proc/diskstats, and /sys/class/hwmon. Surfaces I/O wait stalls and thermal throttling that coarse guest monitors miss entirely.
No PostgreSQL, InfluxDB, or SQLite locks. Guardian keeps a tiered in-memory ring buffer (15s samples for 6h, 5m for 7d, 1h for 30d) that persists to a single JSON file across restarts.
No aggressive 1-second browser polling. One centralized collector loop samples on cadence and streams immutable snapshots to every open tab over Server-Sent Events.
Inspects the Docker daemon socket to detect running containers automatically. Ships with icons and categories for 45+ popular self-hosted apps, including Jellyfin, Sonarr, Radarr, and Home Assistant.
Continuously probes exposed container ports on a 60-second cycle. Catches HTTP latency spikes, redirect loops, 401/403 checkpoints, and silent backend crashes before you notice them.
Reboot or power off your bare-metal server from the header. Disabled by default, and gated behind typing the exact hostname to prevent accidental shutdowns.
Compared against traditional homelab dashboards and monitoring tools.
| Feature / Capability | Guardian | Portainer | Netdata | Homer / Dashy |
|---|---|---|---|---|
| External database needed | None | Embedded local DB | Custom DB engine | None (YAML only) |
| Real host telemetry (/proc, /sys) | ✓ Full VFS precision | ✗ Container stats only | ✓ Full telemetry | ✗ None |
| Streaming updates | ✓ Server-Sent Events | ✗ REST polling | ✓ WebSocket | ✗ Static / fetch |
| Built-in app launcher | ✓ Auto-discovered + widgets | ✗ Management only | ✗ Charts only | ✓ Manual YAML setup |
| Multi-architecture image | ✓ amd64 + arm64 (Pi) | ✓ Yes | ✓ Yes | ✓ Yes |
| Single-command install | ✓ One curl + compose up | ✓ Yes | ✓ Yes | ✗ Manual YAML config first |
From a fanless mini-PC to a multi-socket rack, Guardian delivers identical zero-dependency performance.
No signups, no cloud logins, no config files to write. Copy the command, start the container, open your browser.
Get Started Now